 Delorion
Measure loading performance
Capture a one-run performance report, distinguish SAP loading from local processing and display time, and share the results with support.
Applies to userXpress 1.9.5.50 with loading-performance diagnostics
On this page
Use Information → Diagnostics when startup or loading a connected system is slow. The Performance diagnostics window lets you measure the next startup, open a local report and export it for support.
Diagnostics are off during normal use. Enabling them measures the existing loading process; it does not change which systems, users or roles your configuration loads. A measurement creates files on your computer and does not upload them.
Measure the next startup
Save your work first: this action closes and restarts userXpress. Check that the intended AutoStart connections are configured and enabled.
- Open Information, then select Diagnostics.
- Leave Redact system identifiers in the report selected unless you have approval to retain those identifiers.
- Choose Measure next startup.
- Read the restart confirmation. Choose OK to restart, or Cancel to leave the current session running.
- Let the normal AutoStart sequence and display updates finish. Avoid closing the application while it is measuring.
- Return to Information → Diagnostics and choose Open latest report.
The main-window title includes Performance diagnostics active while the measurement is running. The diagnostics window shows the output location. The restart request applies to one startup, not every later launch.
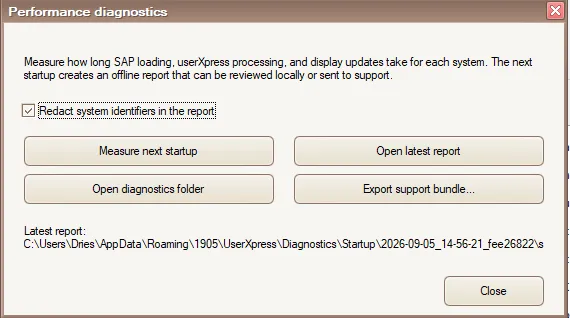
Leave system-identifier redaction selected when preparing a report to share.
Find and read the report
Open latest report opens the latest available HTML report in the default browser. It works offline. Open diagnostics folder opens the saved reports in File Explorer.
Start with the report’s run summary and completion state. Compare the time spent in these areas:
- SAP: retrieving information from SAP, including users and roles.
- userXpress processing: preparing the retrieved information for use.
- Display: showing the loaded information in the workspace.
A slow SAP measurement does not, by itself, identify whether the cause is network latency, server load or the request workload. Include the system and run context when asking support to investigate.
Elapsed is the time inside a step. Self excludes child-step time. Parent steps include their children, so do not add both together. Input/output counts describe the measured workload; per-record values help compare similar operations with different amounts of data. Missing counts are not zero-work proof.
Skipped means that a path was disabled or not applicable. A failed or cancelled run must not be treated as a complete timing result. In particular, opening the main window is not the same as completing all loading and display work.
The per-system breakdown helps locate a slow client. The cross-system summary helps distinguish one slow system from a step that is expensive across several systems. Keep the report’s accompanying files together if Support asks you to share the results.
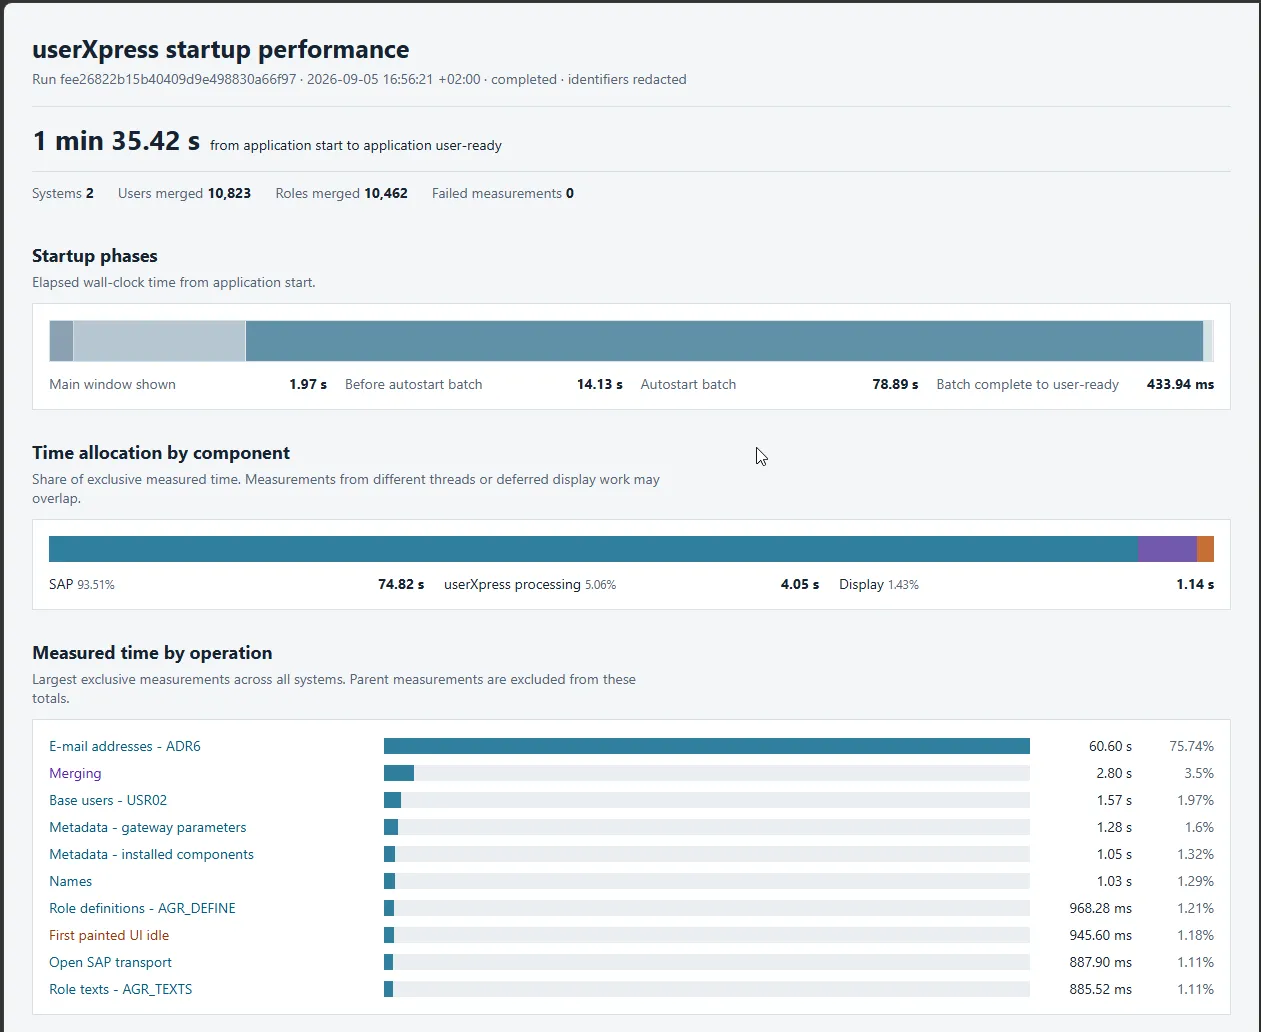
The report separates overall startup time from SAP, processing and display measurements.
Make two runs comparable
If Support asks for another report, keep the same workstation, network connection, systems and loading settings unless asked to change them. Include the application version and describe any differences between the runs. Different record counts or settings can explain a timing change.
Review and share a report
Redaction replaces system descriptions with neutral aliases and removes SID/client values from the generated diagnostics. It does not make unrelated application logs, attachments or screenshots safe to share. Review all material before sending it.
Choose Export support bundle…, select a ZIP destination and save. The ZIP packages the latest report directory; it does not upload anything. Check that it contains the run you intended to share, especially if you have several measurements.
To send it through the application, follow Create a support request. The startup/loading option selects available text and machine-readable files from the latest report. Alternatively, use Add file… to attach the ZIP you reviewed. Avoid attaching both sets unless support needs them.
If a report is missing
Open latest report and Export support bundle are disabled. No HTML report was found for those actions. Check whether a diagnostic run was actually started and completed, and inspect the folder shown for the run. Enabling the performance attachment option in a support request does not generate a report.
Measure next startup is disabled. A diagnostic session is already active. Let the current measurement finish before requesting another startup measurement.
The application failed before loading finished. Preserve the report folder, even if the report is incomplete. Include the failure time and exact symptom in the support request.
Export failed. Read the error, check that the destination is writable and that the intended report files still exist. Choose another approved destination if necessary; do not delete the original report to retry an export.